Power Pivot in Excel: How to Use Excel Formulas for Advanced Data Analysis (30-Min Guide)
Power Pivot in Excel: Want to use Power Pivot like a pro? This step-by-step Hindi/English guide will teach you how to apply Excel formulas in Power Pivot, create dynamic reports, and analyze large datasets—all in just 30 minutes! Perfect for beginners & professionals.
Other Categories
What is Power Pivot in Excel ?
Power Pivot is an advanced Excel add-in that helps you: ✅ Analyze millions of rows of data (unlike regular Excel). ✅ Combine multiple data sources (Excel, SQL, CSV). ✅ Use DAX (Data Analysis Expressions) for powerful calculations. ✅ Build interactive dashboards with PivotTables & PivotCharts.
Example: If you work with sales data, Power Pivot lets you merge order history, customer details, and product lists into a single report.
Why Use Excel Formulas in Power Pivot?
Regular Excel formulas (like VLOOKUP, SUMIF) don’t work efficiently with large datasets. Power Pivot uses DAX formulas, which are: ✔ Faster (handles 100M+ rows). ✔ More flexible (works across multiple tables). ✔ Used in Power BI (learning DAX helps in BI tools).
Common DAX Formulas vs. Excel Formulas
Excel Formula
DAX Equivalent
Use Case
SUM()
SUM()
Basic totals
VLOOKUP()
RELATED()
Fetch data from linked tables
SUMIF()
CALCULATE()
Conditional sums
How to Enable Power Pivot in Excel
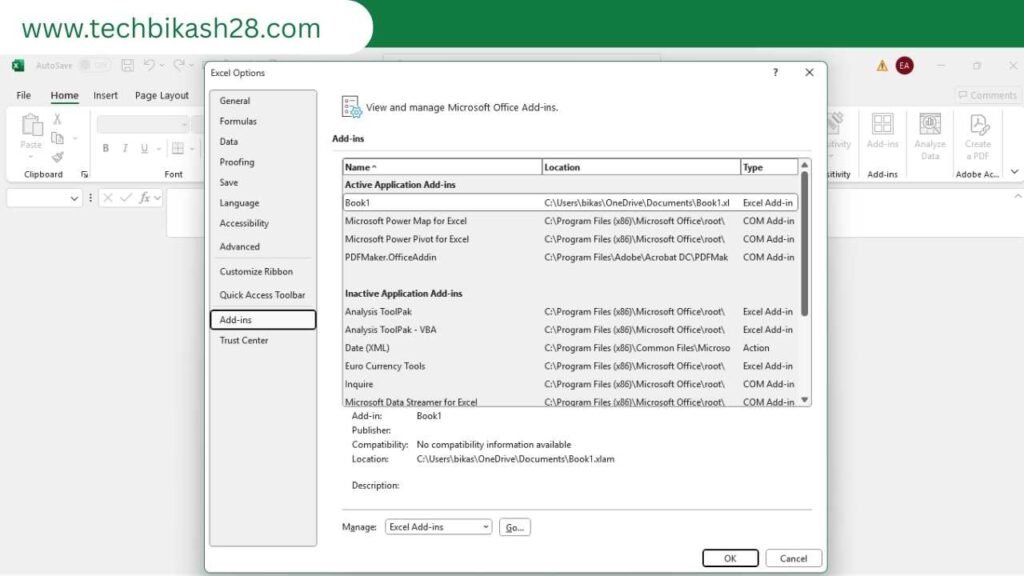
Step 1: Open Excel → File → Options → Add-ins. Step 2: Select COM Add-ins → Click Go. Step 3: Check Microsoft Power Pivot for Excel → OK. ✅ Done! Now, you’ll see the Power Pivot tab in Excel.
How to Import Data into Power Pivot
Go to Power Pivot tab → Manage Data Model.
Click From Other Sources → Choose Excel/CSV/SQL.
Select your file → Load.
Pro Tip: Use “Get External Data” to connect live databases!
Using Excel Formulas in Power Pivot (DAX Basics)
Basic DAX Formulas You Must Know
SUM() – Adds up values.
Total Sales = SUM(Sales[Amount])
RELATED() – Fetches data from linked tables (like VLOOKUP).
Customer Name = RELATED(Customers[Name])
CALCULATE() – Filters data dynamically.
Sales in 2024 = CALCULATE(SUM(Sales[Amount]), Sales[Year] = 2024)
(Add a simple exercise: Try calculating “Profit” using [Revenue] – [Cost] in DAX.)
Creating PivotTables & PivotCharts from Power Pivot
Go to Insert → PivotTable → Select “Use this workbook’s Data Model”.
Drag fields (e.g., Product, Sales) into Rows/Values.
❌ Error: PivotTable not updating. ✅ Fix: Refresh Data (Right-click → Refresh).
❌ Error: DAX formula not working. ✅ Fix: Check table relationships first.
FAQs on Power Pivot
Q1. Is Power Pivot free? ✅ Yes! It’s included in Excel 2016+.
Q2. Can I use VLOOKUP in Power Pivot? ❌ No, use RELATED() instead.
Q3. How is Power Pivot different from Power Query?
Power Query: Data cleaning.
Power Pivot: Data modeling & analysis.
Conclusion<a id=”conclusion”></a>
Now you know how to use Power Pivot with Excel formulas (DAX) to: ✔ Analyze big data faster. ✔ Build advanced reports. ✔ Boost your career with in-demand Excel skills.
Next Step: Watch the full video tutorial here and download the practice file!
Conclusion
Now you know how to use Power Pivot with Excel formulas (DAX) to: ✔ Analyze big data faster. ✔ Build advanced reports. ✔ Boost your career with in-demand Excel skills.
Next Step: Watch the full video tutorial here and download the practice file.
🌐 Who is Bikash Sarangi?
Bikash Sarangi is a tech educator, automation expert, and the founder of TechBikash28, a platform designed to make real-world technology accessible. Recognized by Startup India, his mission is to simplify learning with tools like Google Apps Script, Power BI, Excel, and custom web applications.
From Bhubaneswar, Odisha, to learners across India and beyond, Bikash has created a strong following through practical tutorials, live training sessions, and custom business solutions.